Generated: 2026-06-04 03:39
Date: 2026-06-04 Time: 03:35 Methodology: William O'Neil's CAN SLIM System
Market is HEALTHY - OK to buy breakouts. VIX: 16
| # | Stock | Buy Zone | Stop Loss | Status |
|---|---|---|---|---|
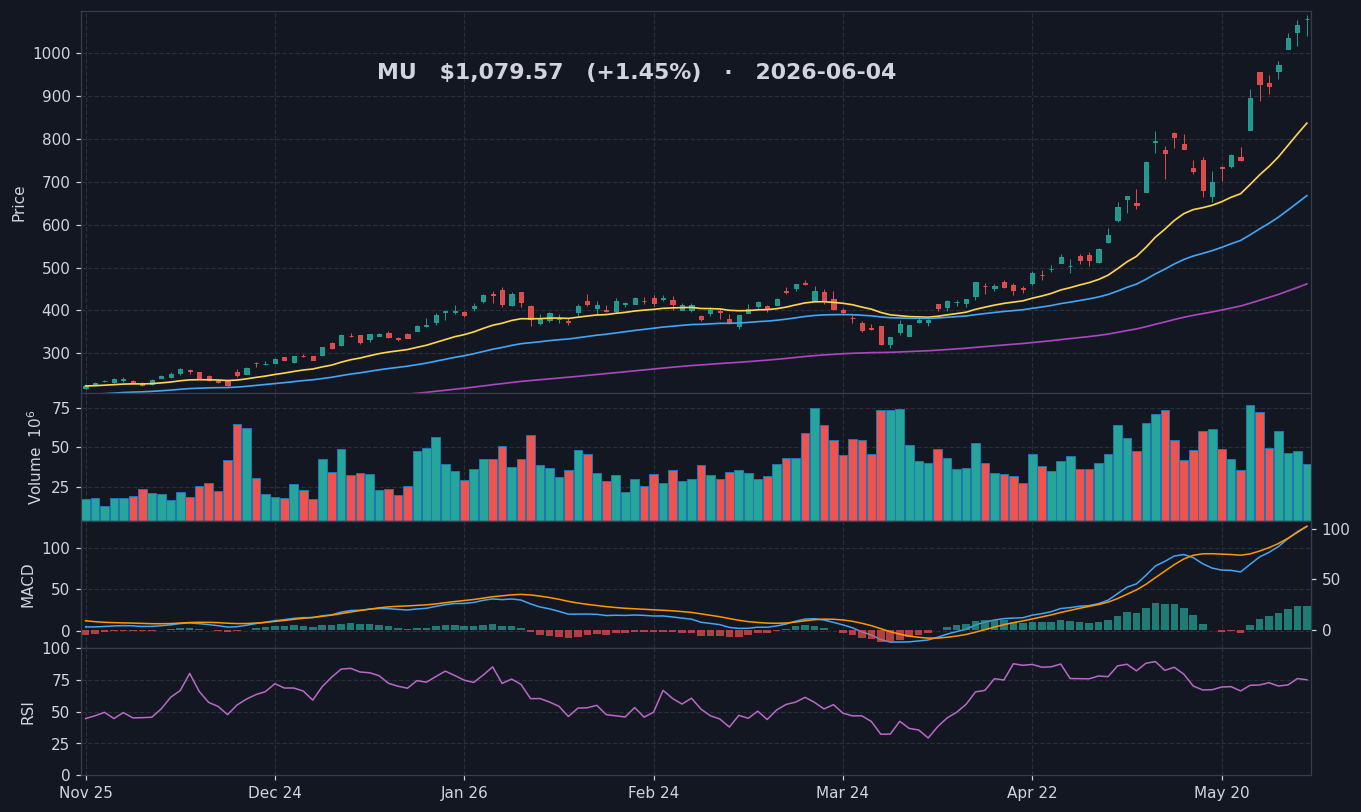
| 1 | MU | $1035-$1089 | $993.20 | BUY NOW |
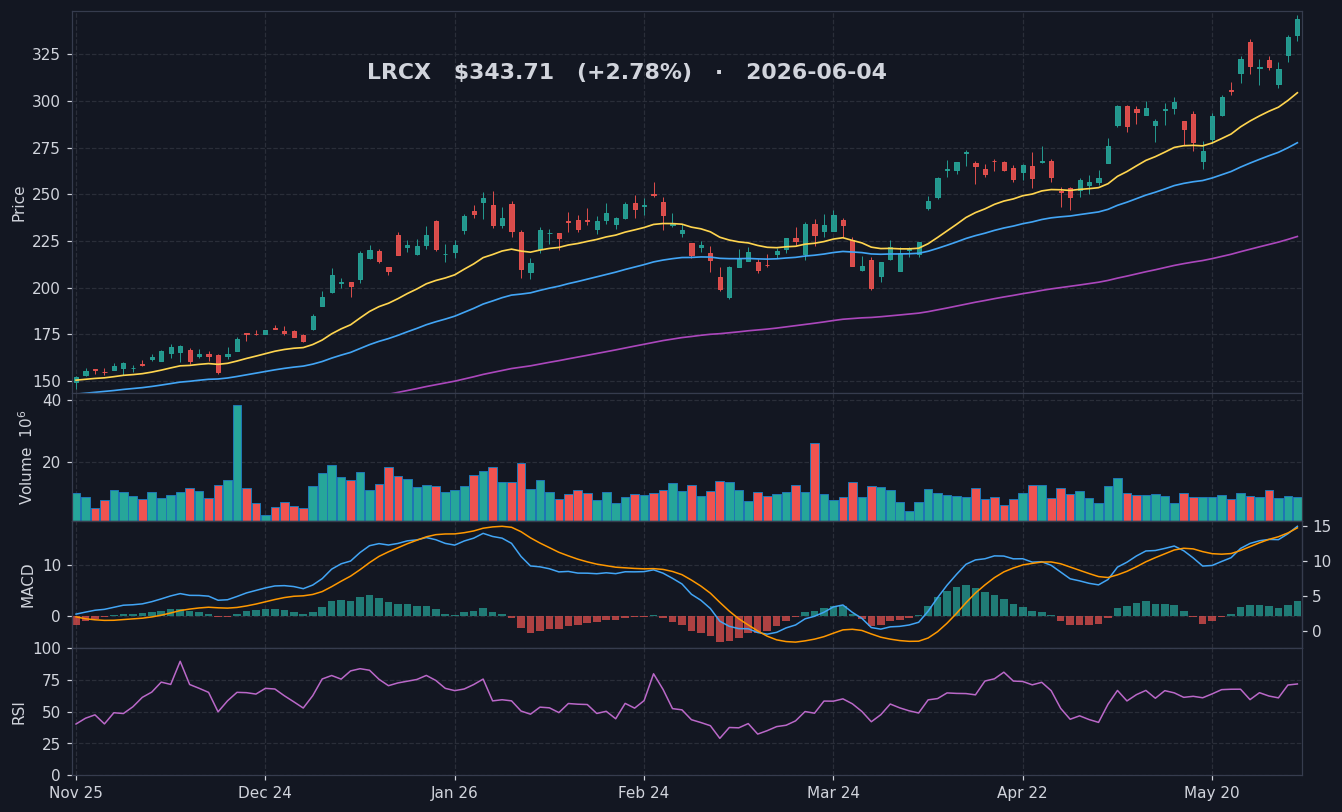
| 2 | LRCX | $329-$346 | $316.21 | BUY NOW |
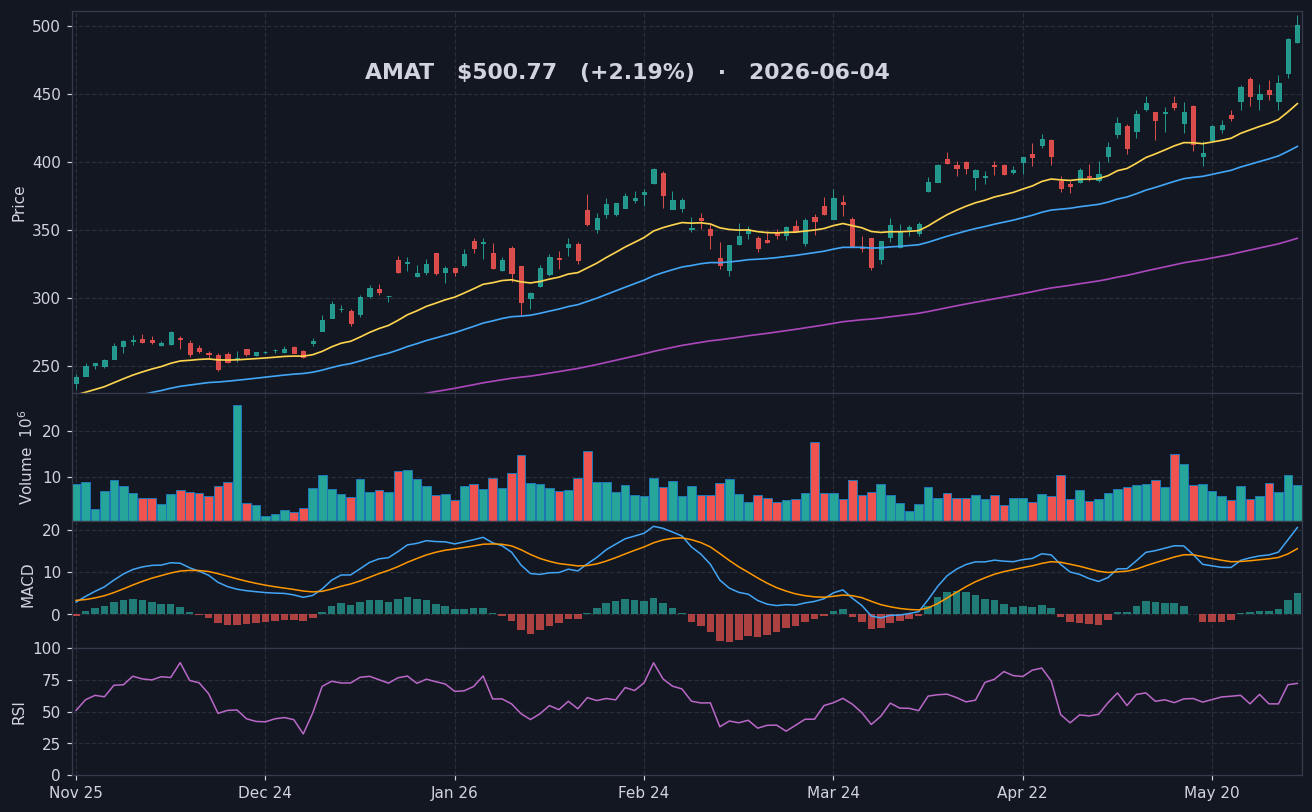
| 3 | AMAT | $483-$508 | $460.71 | BUY NOW |
How Entry Points Work:
Status: 🟢 GREEN LIGHT
| Metric | Value |
|---|---|
| Market Status | CONFIRMED_UPTREND |
| Distribution Days (5 weeks) | 4 |
| Market Trend | UPTREND |
| Can Buy? | YES |
O'Neil Says: "BUY: FTD confirmed on 2026-05-06 - buy leaders breaking out of proper bases"
Today's Action: BUY leaders breaking out of proper bases
Rally Attempt Status:
Market Breadth: 7 Leaders | 0 Strong | 14 Laggards
| Rank | Sector/Industry | ETF | RS | Status |
|---|---|---|---|---|
| 1 | Semiconductors | SMH | 97 | 🟢 LEADER |
| 2 | Auto Manufacturers | CARZ | 94 | 🟢 LEADER |
| 3 | Technology | XLK | 85 | 🟢 LEADER |
| 4 | Utilities - Renewable | ICLN | 84 | 🟢 LEADER |
| 5 | Oil & Gas Equipment & Services | OIH | 82 | 🟢 LEADER |
| 6 | Copper | COPX | 80 | 🟢 LEADER |
| 7 | Steel | SLX | 80 | 🟢 LEADER |
| 8 | Energy | XLE | 59 | ⚪ AVERAGE |
| 9 | Oil & Gas E&P | XOP | 57 | ⚪ AVERAGE |
| 10 | Biotechnology | XBI | 52 | ⚪ AVERAGE |
| Rank | Sector/Industry | ETF | RS | Status |
|---|---|---|---|---|
| 23 | Financial Services | XLF | 27 | 🔴 LAGGARD |
| 24 | Communication Services | XLC | 26 | 🔴 LAGGARD |
| 25 | Home Improvement Retail | XHB | 24 | 🔴 LAGGARD |
| 26 | Electronic Gaming & Multimedia | ESPO | 19 | 🔴 LAGGARD |
| 27 | Medical Devices | IHI | 11 | 🔴 LAGGARD |
O'Neil Insight: "37-50% of a stock's move comes from its industry group"
| Ticker | Price | Score | CAN SLIM | Verdict | Sector | Signals |
|---|---|---|---|---|---|---|
| MU | $1079.57 | 10.0 | 7/7 | ✅ BUY | 🟢 Semiconductors | 📈🎯 |
| LRCX | $343.71 | 10.0 | 7/7 | ✅ BUY | 🟢 Semiconductor E | 📈🎯 |
| AMAT | $500.77 | 9.8 | 7/7 | ✅ BUY | 🟢 Semiconductor E | 🎯 |
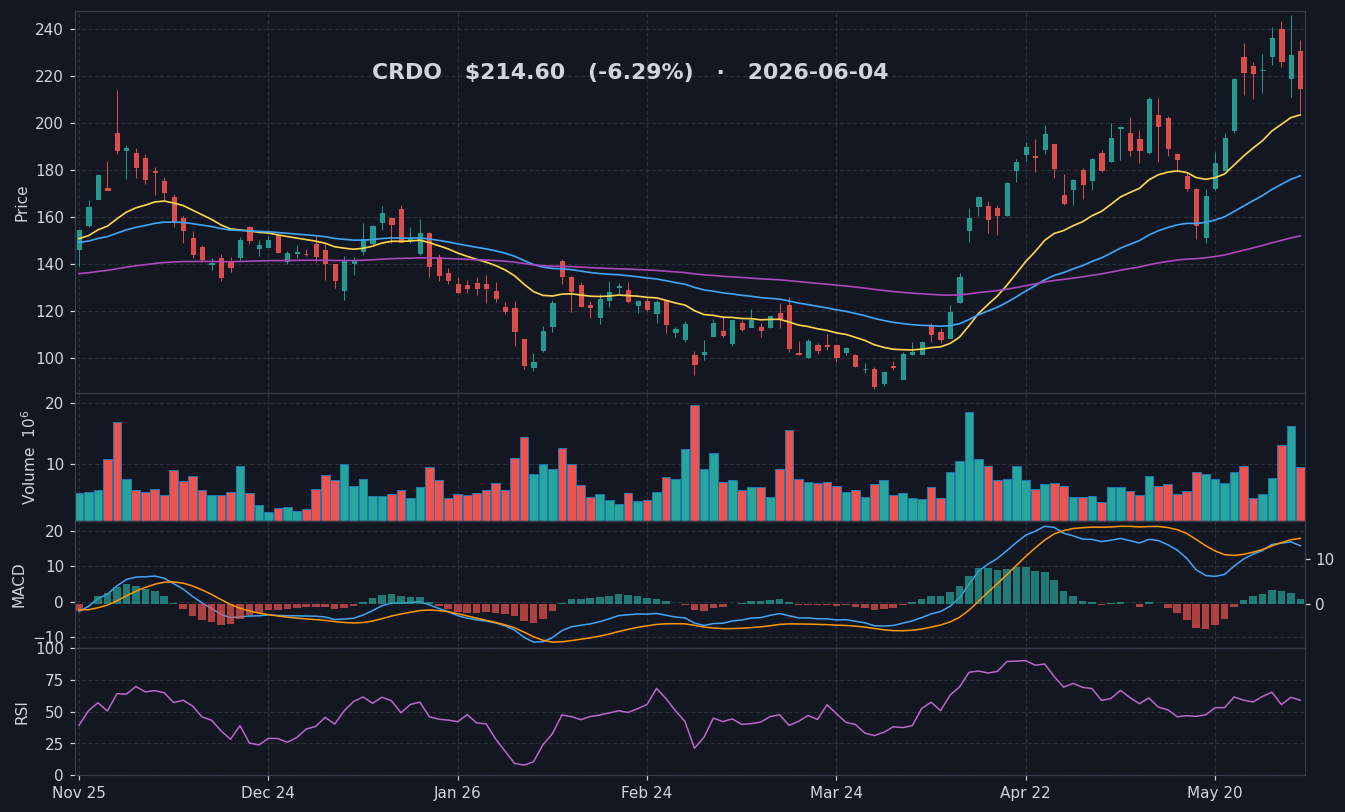
| CRDO | $214.60 | 9.7 | 7/7 | ✅ BUY | 🟢 Semiconductors | 📈 |
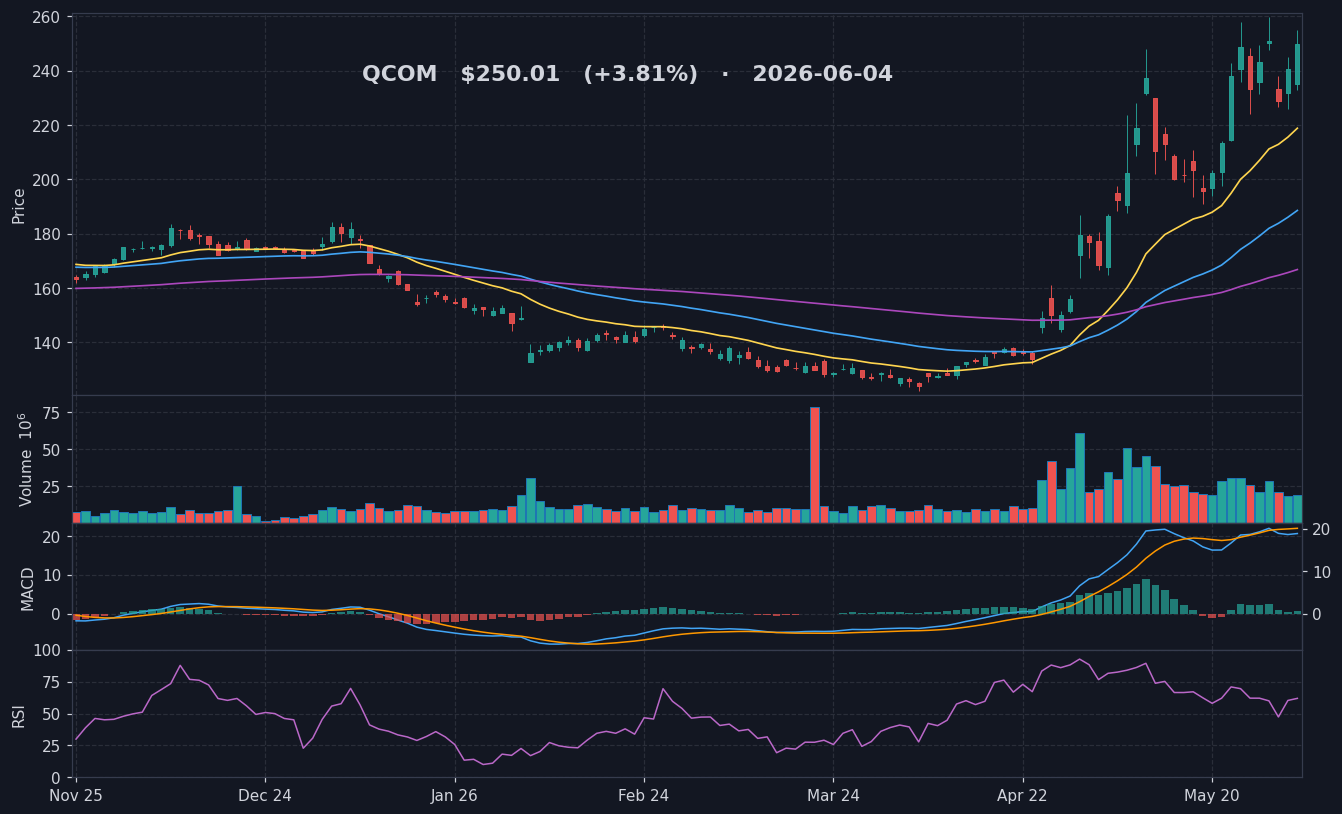
| QCOM | $250.01 | 9.4 | 5/7 | 🔶 HOLD | 🟢 Semiconductors | 🎯 |
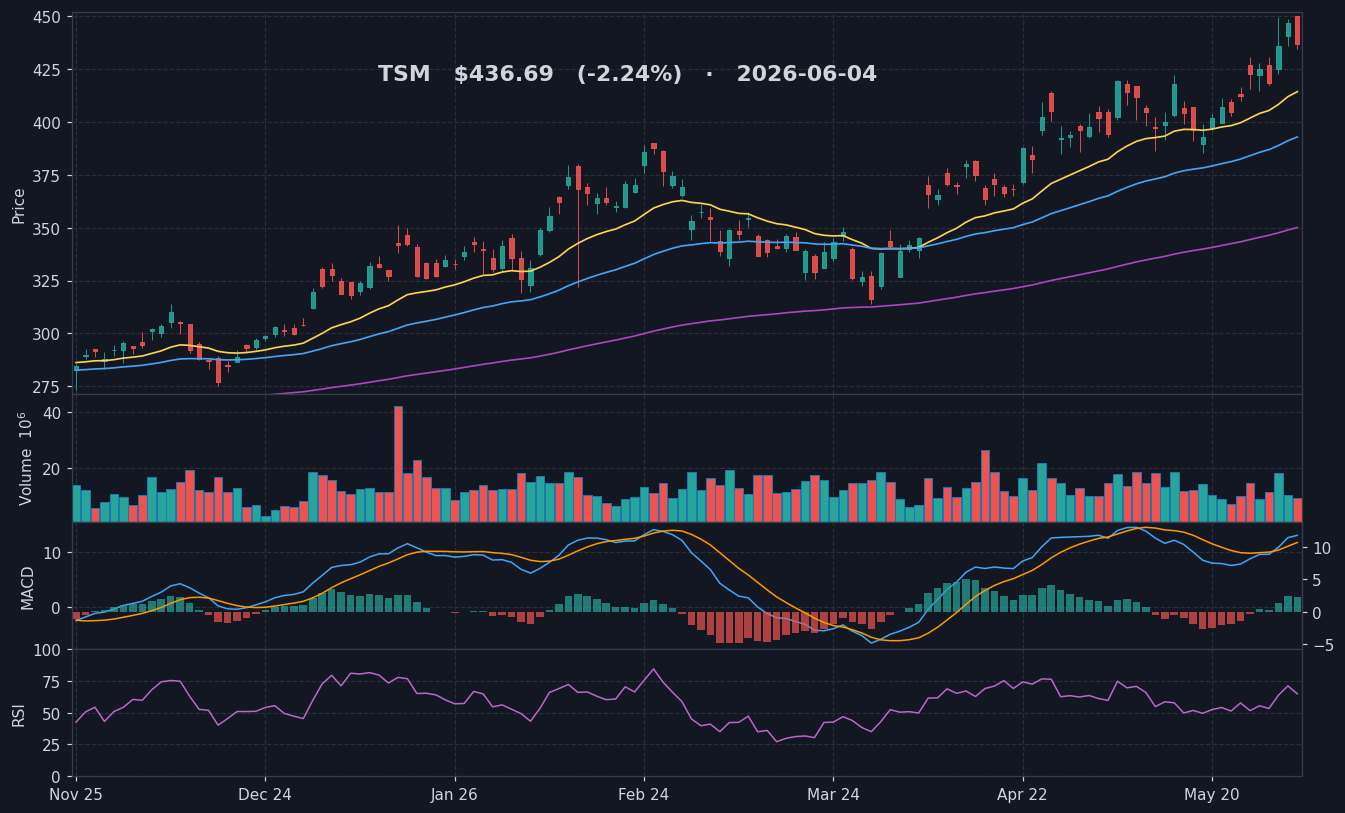
| TSM | $436.69 | 9.4 | 7/7 | ✅ BUY | 🟢 Semiconductors | 📈🎯 |
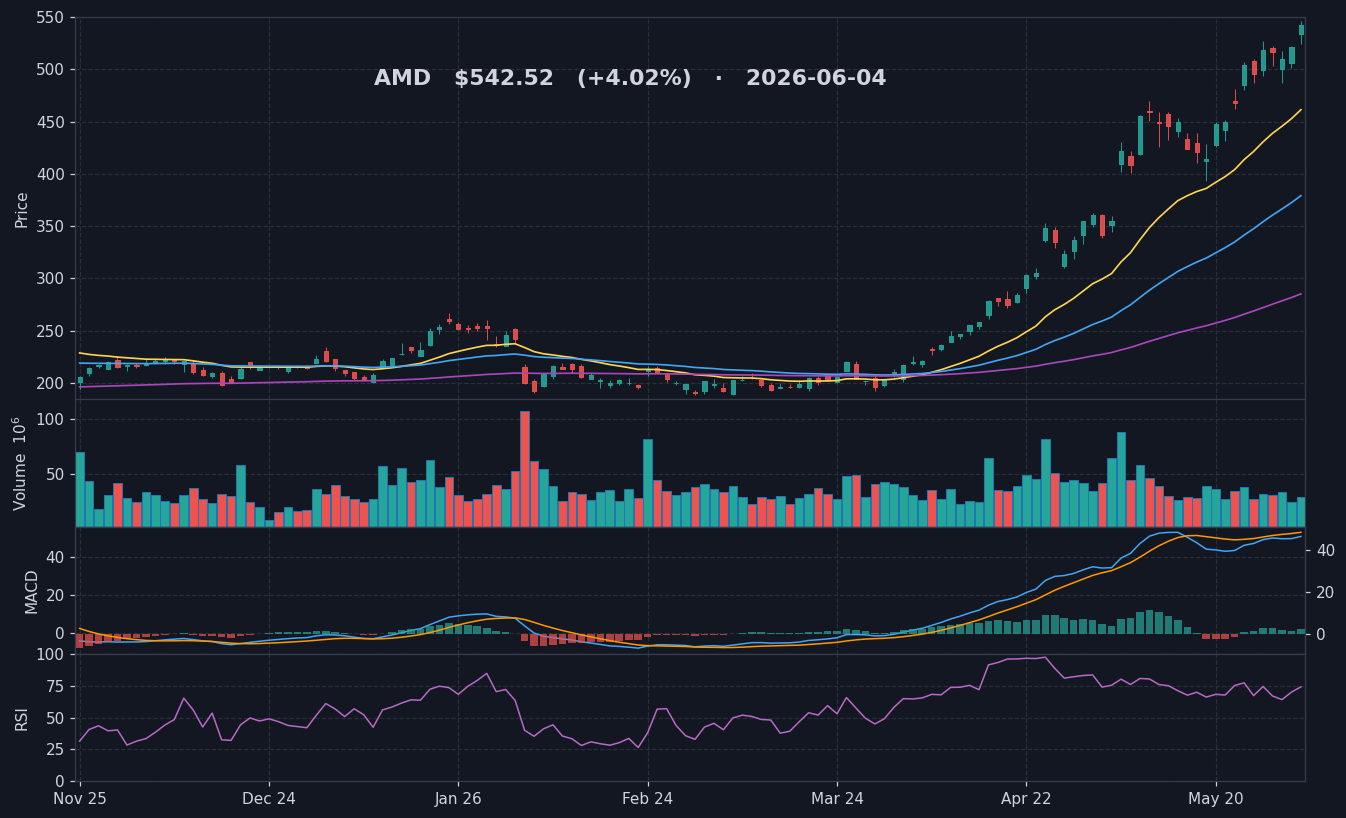
| AMD | $542.52 | 9.3 | 6/7 | ✅ BUY | 🟢 Semiconductors | 📈🎯 |
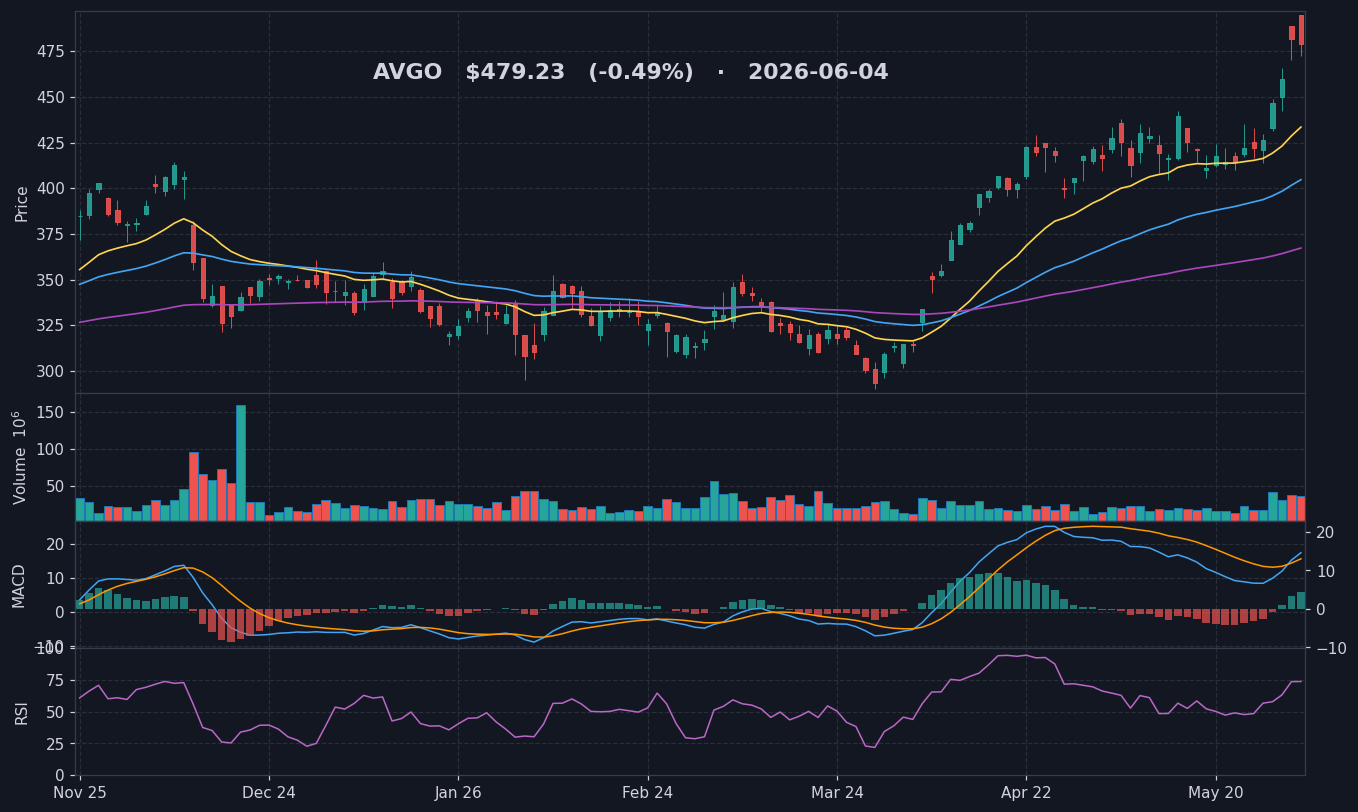
| AVGO | $479.23 | 9.2 | 7/7 | ✅ BUY | 🟢 Semiconductors | 📈🎯 |
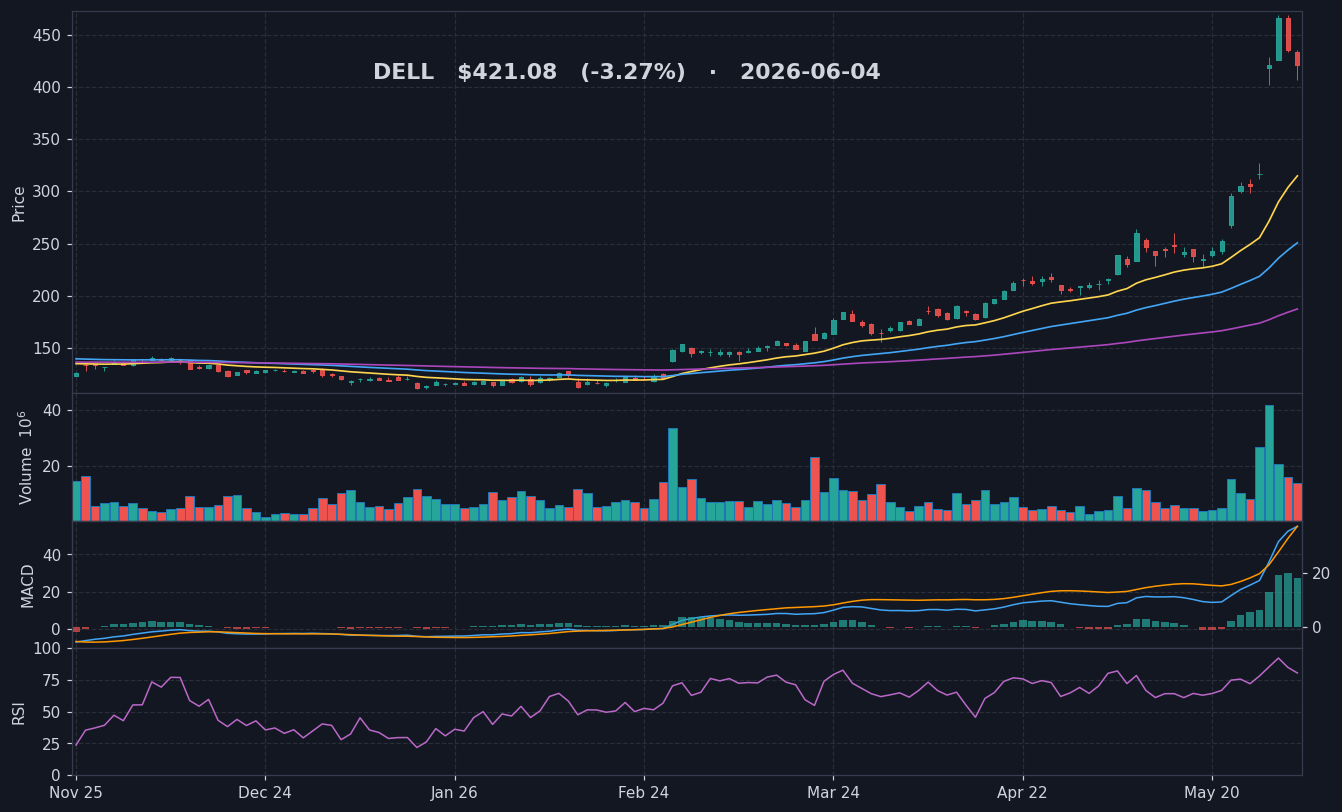
| DELL | $421.08 | 9.1 | 6/7 | ✅ BUY | 🟢 Computer Hardwa | 📈 |
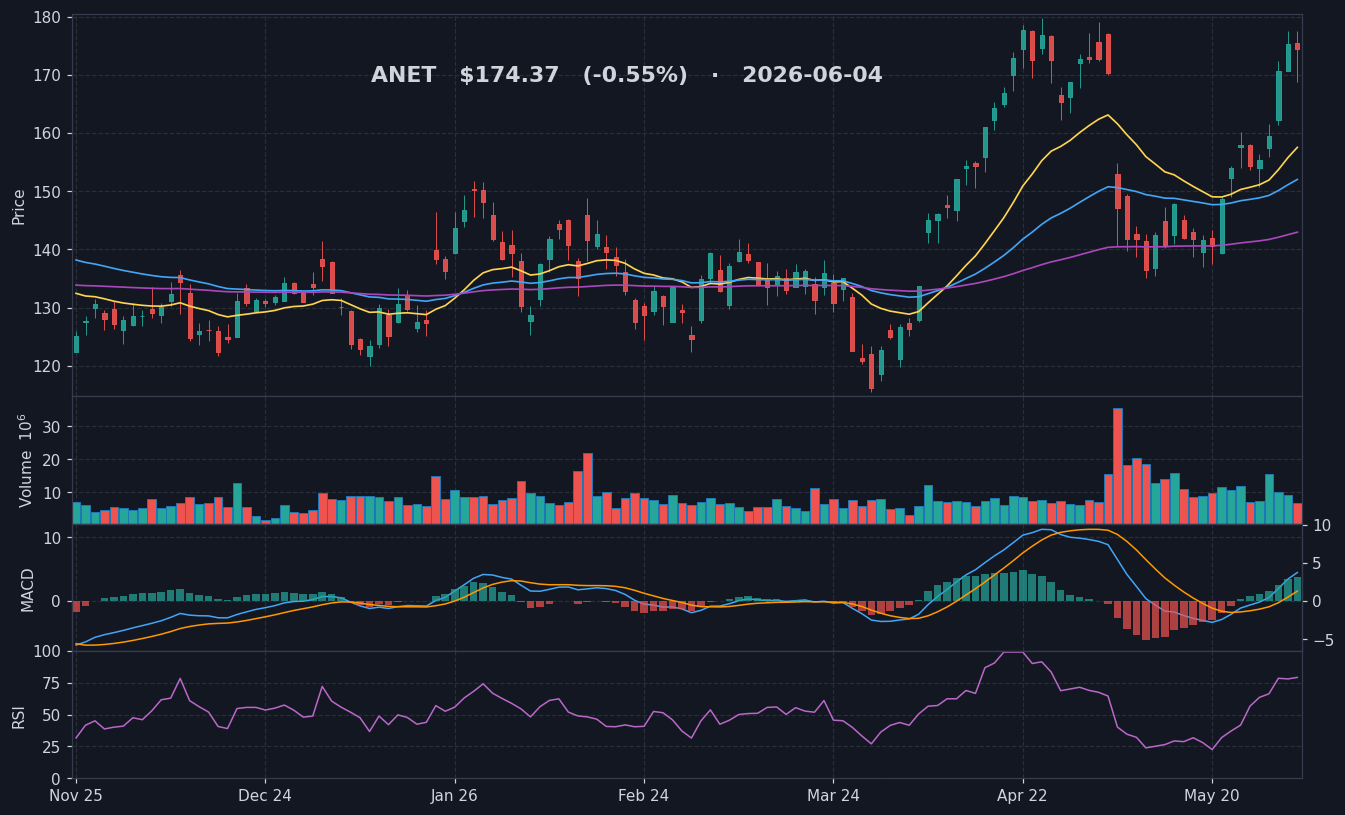
| ANET | $174.37 | 9.0 | 6/7 | ✅ BUY | 🟢 Computer Hardwa | 📈🎯 |
| SMCI | $47.42 | 8.8 | 5/7 | 🔶 HOLD | 🟢 Computer Hardwa | 📈 |
| FTI | $67.94 | 8.6 | 5/7 | 🔶 HOLD | 🟢 Oil & Gas Equip | |
| NVDA | $214.75 | 8.5 | 6/7 | ✅ BUY | 🟢 Semiconductors | 📈🎯 |
| VRT | $331.44 | 8.2 | 6/7 | ✅ BUY | Electrical Equi | 📈 |
| HAL | $41.03 | 8.1 | 4/7 | 🔶 WATCH | 🟢 Oil & Gas Equip | 🎯 |
| WFRD | $104.09 | 8.0 | 4/7 | 🔶 WATCH | 🟢 Oil & Gas Equip | 🎯 |
| KLAC | $2125.11 | 7.8 | 3/7 | ❌ AVOID | 🟢 Semiconductor E | 🎯 |
| AAPL | $310.26 | 7.8 | 4/7 | 🔶 WATCH | 🟢 Consumer Electr | 🎯 |
| GEV | $959.36 | 7.6 | 6/7 | ✅ BUY | Specialty Indus | |
| PWR | $715.67 | 7.2 | 4/7 | 🔶 WATCH | Engineering & C | 📈🎯 |
| BKR | $64.27 | 7.0 | 3/7 | ❌ AVOID | 🟢 Oil & Gas Equip | 🎯 |
| COHR | $417.43 | 7.0 | 5/7 | 🔶 HOLD | 🟢 Scientific & Te | 🎯 |
| RES | $7.12 | 6.8 | 4/7 | 🔶 WATCH | 🟢 Oil & Gas Equip | |
| INTC | $112.71 | 6.7 | 4/7 | 🔶 WATCH | 🟢 Semiconductors | |
| LITE | $938.00 | 6.5 | 3/7 | ❌ AVOID | 🟢 Communication E | |
| SLB | $56.85 | 6.1 | 3/7 | ❌ AVOID | 🟢 Oil & Gas Equip | 🎯 |
| NOV | $20.82 | 6.1 | 3/7 | ❌ AVOID | 🟢 Oil & Gas Equip | 🎯 |
| HPE | $55.15 | 6.0 | 4/7 | 🔶 WATCH | 🟢 Communication E | |
| PTEN | $12.01 | 5.5 | 4/7 | 🔶 WATCH | Oil & Gas Drill | 🎯 |
| ORCL | $230.33 | 5.3 | 3/7 | ❌ AVOID | Software - Infr | |
| NBIS | $251.68 | 5.3 | 4/7 | 🔶 WATCH | Internet Conten | 🎯 |
| HP | $38.44 | 5.2 | 4/7 | 🔶 WATCH | Oil & Gas Drill | 🎯 |
| CEG | $267.24 | 4.0 | 2/7 | ❌ AVOID | Utilities - Ind | 📈 |
| MSFT | $427.34 | 3.6 | 3/7 | ❌ AVOID | Software - Infr | |
| CRM | $190.61 | 3.2 | 1/7 | ❌ AVOID | Software - Appl | |
| ADBE | $256.24 | 2.9 | 1/7 | ❌ AVOID | Software - Appl | |
| CHX | $0.00 | 2.6 | 2/7 | ❌ AVOID | Unknown |
Legend: 📈 = Earnings Acceleration | 🎯 = Near 52-Week High | 🟢 = Leading Sector | 📅 = Earnings Soon (WAIT!) | Click ticker for TradingView chart
Market: GREEN LIGHT - Buy leaders on breakouts
| Rank | Ticker | Score | Sector | RS | Signals | Action | Stop |
|---|---|---|---|---|---|---|---|
| 🥇 | MU | 10.0 | 🟢 Semiconducto | 97 | 📈EA 🎯NH | ✅ BUY | $1004 |
| 🥈 | LRCX | 10.0 | 🟢 Semiconducto | 85 | 📈EA 🎯NH | ✅ BUY | $320 |
| 🥉 | AMAT | 9.8 | 🟢 Semiconducto | 85 | 🎯NH | ✅ BUY | $466 |
| #4 | CRDO | 9.7 | 🟢 Semiconducto | 97 | 📈EA | ✅ BUY | $200 |
| #5 | QCOM | 9.4 | 🟢 Semiconducto | 97 | 🎯NH | 👁️ WATCH | $233 |
| #6 | TSM | 9.4 | 🟢 Semiconducto | 97 | 📈EA 🎯NH | ✅ BUY | $406 |
| #7 | AMD | 9.3 | 🟢 Semiconducto | 97 | 📈EA 🎯NH | ✅ BUY | $505 |
| #8 | AVGO | 9.2 | 🟢 Semiconducto | 97 | 📈EA 🎯NH | ✅ BUY | $446 |
| #9 | DELL | 9.1 | 🟢 Computer Har | 85 | 📈EA | ✅ BUY | $392 |
| #10 | ANET | 9.0 | 🟢 Computer Har | 85 | 📈EA 🎯NH | ✅ BUY | $162 |
Legend: 📈EA = Earnings Acceleration | 🎯NH = Near High | 🟢 = Leader Sector | * = Weaker sector
Score: 10.0 | Semiconductors | Open Chart
Why: Leading Sector | Earnings Accelerating | Near Breakout | RS: 97
BUY NOW - Already in Buy Zone!
Current: $1079.57 | 52W High: $1089.29 (0.9% below) Buy Zone: $1034.83 - $1089.29 (You're IN!)
| Entry Point | Stop (-8%) | Target (+20%) |
|---|---|---|
| $1079.57 | $993.20 | $1295.48 |
BUY TRIGGER (Execute when ALL conditions met): 1. Price crosses above $1081.73 (current + 0.2%) 2. Volume is 50%+ above average (check pre-market or first 30min) 3. Market is GREEN or YELLOW (check top of report)
DO NOT BUY IF:
BUY 9 MU LMT 1084.97
STOP LOSS: $993.20Score: 10.0 | Semiconductor Equipm | Open Chart
Why: Leading Sector | Earnings Accelerating | Near Breakout | RS: 85
BUY NOW - Already in Buy Zone!
Current: $343.71 | 52W High: $346.18 (0.7% below) Buy Zone: $328.87 - $346.18 (You're IN!)
| Entry Point | Stop (-8%) | Target (+20%) |
|---|---|---|
| $343.71 | $316.21 | $412.45 |
BUY TRIGGER (Execute when ALL conditions met): 1. Price crosses above $344.40 (current + 0.2%) 2. Volume is 50%+ above average (check pre-market or first 30min) 3. Market is GREEN or YELLOW (check top of report)
DO NOT BUY IF:
BUY 29 LRCX LMT 345.43
STOP LOSS: $316.21Score: 9.8 | Semiconductor Equipm | Open Chart
Why: Leading Sector | Near Breakout | RS: 85
BUY NOW - Already in Buy Zone!
Current: $500.77 | 52W High: $508.26 (1.5% below) Buy Zone: $482.85 - $508.26 (You're IN!)
| Entry Point | Stop (-8%) | Target (+20%) |
|---|---|---|
| $500.77 | $460.71 | $600.92 |
BUY TRIGGER (Execute when ALL conditions met): 1. Price crosses above $501.77 (current + 0.2%) 2. Volume is 50%+ above average (check pre-market or first 30min) 3. Market is GREEN or YELLOW (check top of report)
DO NOT BUY IF:
BUY 19 AMAT LMT 503.27
STOP LOSS: $460.71Add these indicators to your TradingView chart for proper entry execution:
| # | Indicator | Settings | What to Look For |
|---|---|---|---|
| 1 | SMA (50) | Length: 50, Color: Blue | Price ABOVE = Trend OK |
| 2 | SMA (200) | Length: 200, Color: Red | Price ABOVE = Bull Market |
| 3 | Volume | Default + 20 MA overlay | Volume > 150% of MA = Confirmation |
| 4 | RS Line vs SPY | Compare: SPY | Line making NEW HIGH = Strong |
1. Open TradingView chart 2. Click "Compare" or "+" button (top toolbar) 3. Type "SPY" and select it 4. Right-click SPY line -> "Move to" -> "New Pane Below" 5. Now you see: Price chart on top, RS Line (your stock / SPY) below
| Indicator | Purpose |
|---|---|
| ATR (14) | Position sizing / Stop placement |
| VWAP | Intraday entry confirmation |
| VIX | Add as separate chart tab for panic detection |
For each stock in your watchlist, create alerts: 1. Breakout Alert: Price crosses ABOVE [Entry Point] 2. Stop Loss Alert: Price crosses BELOW [Stop Price] 3. Volume Spike Alert: Volume crosses ABOVE (20 SMA * 1.5)
Daily candles, 6 months. Overlays: EMA20 (yellow), EMA50 (blue), EMA150 (purple). Subplots: volume, MACD, RSI(14).
Top 3 pick(s) from today's focus list, classified by Gemini.
| Ticker | Sentiment | Bull/Bear/Neutral | Spam Filtered | Influencer Share | Risk |
|---|---|---|---|---|---|
| MU | 🟢 bull (+0.38) | 9🟢/4🔴/6⚪ | 1 🗑️ | 37% infl | — |
| LRCX | 🟢 bull (+1.00) 🟡 n=6 | 6🟢/0🔴/7⚪ | 0 🗑️ | 0% infl | — |
| AMAT | 🟢 bull (+1.00) | 20🟢/0🔴/0⚪ | 0 🗑️ | 30% infl | — |
Reading the table:
Full top-20 tweets per ticker: social_2026-06-04.md
🎯 TODAY'S ACTION: Consider buying MU if it breaks out on volume.
| Step | Action | Details |
|---|---|---|
| 1️⃣ | Check Market | 🟢 GREEN - BUY breakouts |
| 2️⃣ | Review Charts | Open TradingView for top picks |
| 3️⃣ | Set Alerts | Price alerts at breakout levels |
| 4️⃣ | Position Size | Max 2 positions, $50K each |
| 5️⃣ | Set Stops | -8% from entry (always!) |
Vol Yesterday = prior-day volume ratio. Check live volume at US market open (4:30 PM Israel / 9:30 AM ET)
| Ticker | Entry | Stop | Target | Vol Yesterday | 30-Min Target |
|---|---|---|---|---|---|
| MU | $1079.57 | $993.20 | $1295.48 | 0.8x LOW | >5.6M shares |
| LRCX | $343.71 | $316.21 | $412.45 | 0.9x LOW | >1.1M shares |
| AMAT | $500.77 | $460.71 | $600.92 | 1.2x | >783K shares |
| CRDO | $233.65 | $214.96 | $280.38 | 1.3x | >832K shares |
| TSM | $436.69 | $401.75 | $524.03 | 0.7x LOW | >1.6M shares |
At 4:30 PM Israel (market open), check each stock's volume on TradingView:
1. Open the stock chart on TradingView (1-min or 5-min timeframe) 2. At 5:00 PM Israel (30 min after open), check total volume for the day 3. If volume already exceeds the "30-Min Target" above = institutions are buying, GO 4. If volume is below target = no conviction yet, WAIT
> "On the day of a breakout, I want to see volume at least 150% of average. In the first hour you can already tell - if volume is running hot, institutions are moving in." - Mark Minervini
Entry Strategy: RELAXED (RS + Price > MA50) - "Loose Entry, Tight Exit" Exit Strategy: O'Neil + Minervini Trailing Stops (BE at +16%, Trail at +20%) Rotation Rules: MU Rule (20%+ winners protected), RS Threshold (+5)
Generated by EntreEco CAN SLIM System "The whole secret to winning in the stock market is to lose the least amount possible when you're not right." - William O'Neil